Image Details
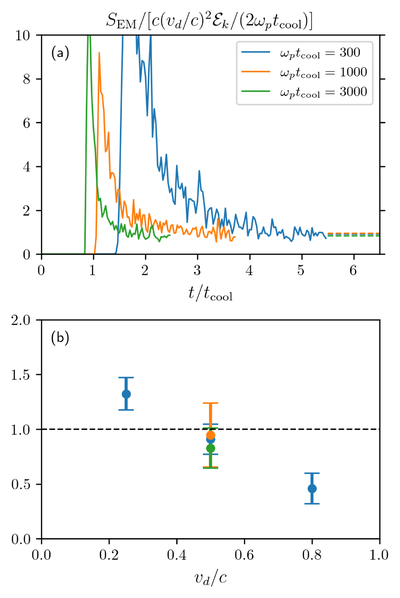
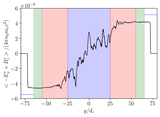
Caption: Figure 5.
Dependence of the normalized Poynting vector, SEM, of electromagnetic radiation escaping through the y-boundaries of 2X1V simulations on the cooling strength (panel (a), for a fixed vd/c = 0.5) and the drift speed (panel (b)). The blue, orange and green data points in both panels correspond to simulations with cooling times ωptcool = 300, 1000, and 3000, respectively. The values represented by the dashed lines in panel (a) and the points in panel (b) are calculated from the data taken over the last 0.5tcool of each simulation. The error bars represent fluctuations of the measured Poynting flux.
Other Images in This Article
Copyright and Terms & Conditions
© 2025. The Author(s). Published by the American Astronomical Society.
Copyright ©
2026 Astronomy Image Explorer. All Rights Reserved.