Image Details
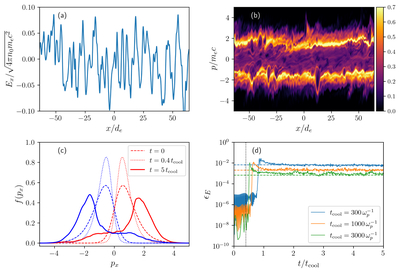
Caption: Figure 2.
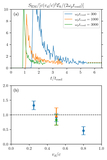
Results of the 1X1V simulations. Panels (a) and (b) show snapshots of the electric field and distribution functions in the phase space, f(x, px), at the end of the simulation with vd/c = 0.5 and ωptcool = 3000, measured at t = 5tcool. Panel (c) shows the distribution functions, f(px), at the beginning of the simulation, just before the onset of the instability, and at the saturation. Panel (d) shows the evolution of the electric field energy density normalized to the kinetic energy density, ϵE, for different cooling times, tcool. The vertical dotted line marks t = 0.4tcool, which corresponds to the moment just before the onset of the instability. The saturated turbulence level is consistent with ﹩{\epsilon }_{E}\approx 2{({\omega }_{p}{t}_{{\rm{cool}}})}^{-1}﹩ (indicated by the horizontal dashed lines) for all three simulations with different tcool.
Other Images in This Article
Copyright and Terms & Conditions
© 2025. The Author(s). Published by the American Astronomical Society.