Image Details
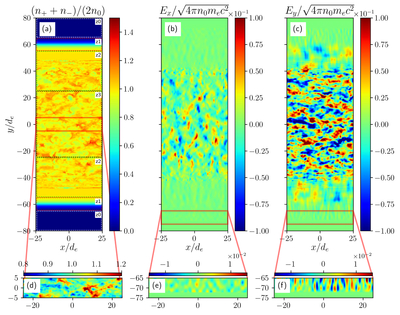
Caption: Figure 3.
Snapshot during the quasi-steady state of the 2X1V simulation for vd/c = 0.5, ωptcool = 3000. Panels (a)–(c) show the snapshots of plasma density, n+ + n−, and electric field components, Ex, Ey, displaying the excitation of turbulence in the current-carrying zone, as well as the production and propagation of electromagnetic waves. In panel (a), different zones are indicated with dashed boxes and labeled as follows: “z0” is the vacuum zone, “z1” is the density transition zone, “z2” is the current transition zone, and “z3” is the current zone. The inset panel (d) shows density fluctuations in the current-carrying zone, and the inset panels (e)–(f) show electromagnetic waves escaping through the absorbing layers.
Other Images in This Article
Copyright and Terms & Conditions
© 2025. The Author(s). Published by the American Astronomical Society.