Image Details

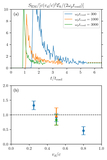
Caption: Figure 8.
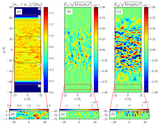
Poynting flux of the superluminal component of the electromagnetic field in a simulation with vd/c = 0.5, ωptcool = 3000. The Poynting flux is computed from the reconstructed spatial field components, which are obtained by performing an inverse Fourier transform for the superluminal part of the spectrum. The purple, red, green, and white colored regions show the central current zone, current transition zone, density transition zone, and vacuum zone, respectively. The values of the Poynting fluxes computed from the full electromagnetic field components in the vacuum zone are shown by the blue dashed lines.
Other Images in This Article
Copyright and Terms & Conditions
© 2025. The Author(s). Published by the American Astronomical Society.