Image Details
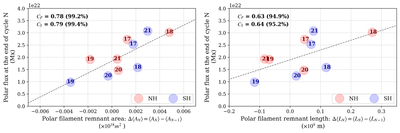
Caption: Figure 4.
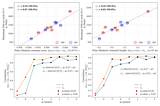
The left panel shows the correlation between the remnant average polar filament area, Δ〈AN〉, and the polar flux at the end of the Nth cycle. The right panel displays the corresponding correlation between Δ〈LN〉 and the polar flux strength of the end of sunspot cycle N. Red and blue circles represent data from the northern and southern hemispheres, respectively. The cycle number labeling each circle refers to cycle N. The black dashed line in both panels indicates the best linear fit to the data.
Other Images in This Article
Copyright and Terms & Conditions
© 2025. The Author(s). Published by the American Astronomical Society.
Copyright ©
2026 Astronomy Image Explorer. All Rights Reserved.