Image Details
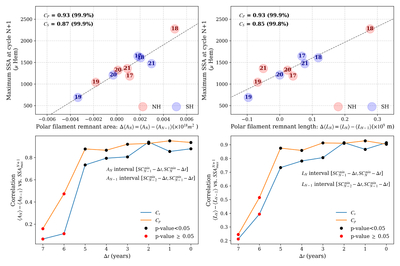
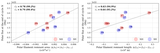
Caption: Figure 5.
Correlation of polar filament remnant over solar cycle (SC) N and N − 1 with maximum sunspot area (SSA) of cycle N + 1. The top left panel shows the correlation between the remnant average polar filament area, Δ〈AN〉, and the maximum sunspot area of the N + 1th cycle. The top right panel displays the corresponding correlation between Δ〈LN〉 and the peak sunspot area of the next cycle. Red and blue circles represent data from the northern and southern hemispheres, respectively. The cycle number labeling each circle refers to cycle N. The black dashed line in both panels indicates the best linear fit to the data. Bottom panels show the result from sliding the correlation coefficient in time Δt before the end of cycle N calculated for the Δ〈AN〉 (left) and Δ〈LN〉 (right), showing statistically significant (p-value < 0.05) correlation with ﹩{\mathrm{SSA}}_{\max }^{N+1}﹩ for Δt ≤ 5 yr measured relative to the solar minimum of cycle N.
Other Images in This Article
Copyright and Terms & Conditions
© 2025. The Author(s). Published by the American Astronomical Society.