Image Details
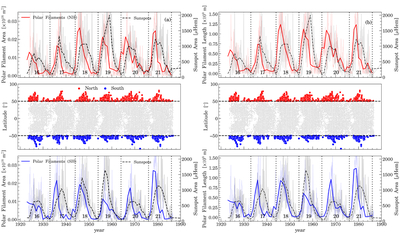
Caption: Figure 2.
Latitudinal distribution and temporal evolution of polar filament (a) area and (b) length, marked by hemisphere for solar cycles 16–21. (Middle panels) The latitudinal distribution of all filaments extracted is presented, revealing a characteristic butterfly-like pattern, with the polar filaments (∣θ∣ ≥ 50°) highlighted in red and blue for the northern and southern hemispheres, respectively. (Top panels) The temporal evolution of (a) area and (b) length of the polar filaments in the northern hemisphere (shown in red continuous lines), compared with the sunspot area (shown in dashed black lines) in the same. The comparatively lighter red and black curves in the background show Carrington-rotation-aggregated and monthly averaged polar filament parameters and sunspot area, respectively. Dim gray dotted lines indicate the end epoch of each cycle. (Bottom panels) The same is shown in the southern hemisphere. All time series have been smoothed using a 13 month running average to enhance clarity.
Other Images in This Article
Copyright and Terms & Conditions
© 2025. The Author(s). Published by the American Astronomical Society.