Image Details
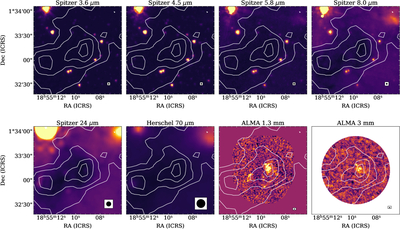
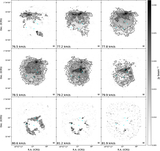
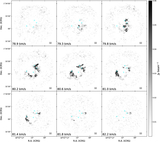
Caption: Figure B1.
Multiwavelength continuum images in the range of 3.6 μm–3 mm. Top row: Spitzer 3.6, 4.5, 5.8, and 8.0 μm images from GLIMPSE (E. Churchwell et al. 2009). Bottom row: Spitzer 24 μm image from MIPSGAL (S. J. Carey et al. 2009), Herschel 70 μm image, ALMA 1.3 mm image from ASHES (K. Morii et al. 2023), and ALMA 3 mm image (this work). White contours indicate the dust continuum from the combined Planck/High Frequency Instrument and APEX/LABOCA map of the ATLASGAL survey, shown at levels of 4σ, 5σ, 6σ, 7σ, and 8σ, where σ = 0.18 Jy beam−1. The angular resolution is shown at the bottom of each panel.
Other Images in This Article
Copyright and Terms & Conditions
© 2025. The Author(s). Published by the American Astronomical Society.
Copyright ©
2026 Astronomy Image Explorer. All Rights Reserved.