Image Details
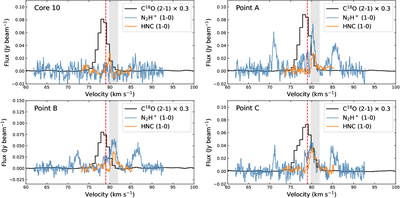
Caption: Figure 2.
The line profiles of C18O (2–1), HNC (1–0), and N2H+ (1–0), extracted from synthesized beam-averaged regions centered on core10, positions A, B, and C (as shown in Figure 1). The vertical red dashed line indicates the systemic velocity, and the shaded region shows the integrated velocity range for the ring component.
Other Images in This Article
Copyright and Terms & Conditions
© 2025. The Author(s). Published by the American Astronomical Society.
Copyright ©
2026 Astronomy Image Explorer. All Rights Reserved.