Image Details
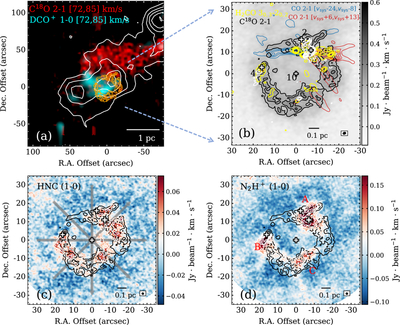
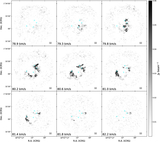
Caption: Figure 1.
(a) Integrated intensity map of C18O (2–1) from ALMA 12m+7m+TP data with full UV coverage, integrated over the velocity range 79.9–81.9 km s−1, overlaid on large-scale two-color maps of G34.74−0.12. The red and cyan colors represent the integrated intensities of C18O (2–1) and DCO+ (1–0), respectively, over the velocity range of 72–85 km s−1, obtained from IRAM-30 m observations (S. Feng et al. 2020). White contours represent the dust continuum emission from the combined Planck and APEX 870 μm map of the ATLASGAL survey, shown at contour levels of 4σ, 5σ, 6σ, 7σ, and 8σ, where σ = 0.18 Jy beam−1. The orange contours represent the C18O (2–1) gas ringlike structure with levels starting from 10σ and increase in steps of 3σ (1σ = 0.02 Jy beam−1 km s−1). The relative coordinate center (0, 0) denotes the center of the ring. (b) The grayscale map and black contours represent the integrated intensity of the C18O (2–1) ring (integrated velocity range: 79.9–81.9 km s−1). The contour level are same as (a). The blue and red contours represent the blue- and redshifted components of outflows traced by CO (2–1), respectively (S. Lin et al. 2025). The yellow contours represent the integrated intensity of H2CO (30,3–20,2) within the same integrated velocity range of C18O (2–1), showing a similar ringlike morphology. The contour levels of H2CO start from 4σ and increase in steps of 4σ (1σ = 0.01 Jy beam−1 km s−1). The white contours represent the 1.3 mm dust continuum from ASHES observations. White crosses outlined in black mark the positions of cores 1, 2, 4, and 10, as labeled by K. Morii et al. (2023). (c) C18O (2–1) ring overlaid on the integrated intensity map of HNC (1–0). The black contours represents the C18O (2–1) gas ringlike structure, same as (a). The white contours represents the HNC (1–0) emission with levels starting from 3σ and increasing in steps of 2σ (1σ = 0.012 Jy beam−1 km s−1), integrated over the same integrated velocity range of C18O (2–1). The gray arrows indicate the paths along four different directions, corresponding to a P.A. of 0°, 45°, 90°, and 135°. (d) C18O (2–1) ring overlaid on the integrated intensity map of N2H+ (1–0), derived by stacking its hyperfine components. The black contours represent the C18O (2–1) gas ringlike structure, same as panel (a). The white contours represent the N2H+ (1–0) emission with levels starting from 3σ and increasing in steps of 2σ (1σ = 0.019 Jy beam−1 km s−1), integrated over the same integrated velocity range of C18O (2–1). A, B, and C mark the positions where HNC (1–0), N2H+ (1–0), and C18O (2–1) lines all show emissions S/N > 4. The synthesized beam for each line is shown in the bottom right corner of each panel.
Other Images in This Article
Copyright and Terms & Conditions
© 2025. The Author(s). Published by the American Astronomical Society.