Image Details
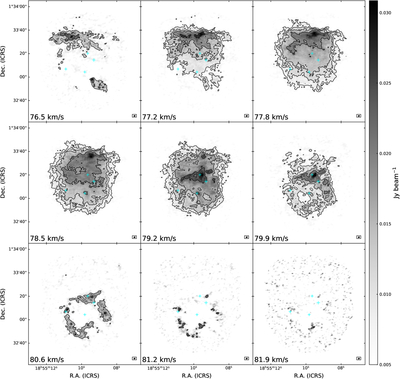
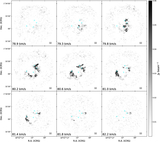
Caption: Figure A1.
C18O (2–1) channel map. The contour levels start from 5σ and increase in steps of 6σ (1σ = 0.007 Jy beam−1). The cyan crosses indicate the position of cores 1, 2, 4, and 10, as labeled in Figure 1. The synthesized beam is given in the bottom right.
Other Images in This Article
Copyright and Terms & Conditions
© 2025. The Author(s). Published by the American Astronomical Society.
Copyright ©
2026 Astronomy Image Explorer. All Rights Reserved.