Image Details
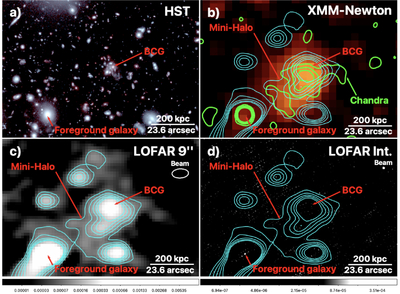
Caption: Figure 1.
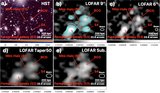
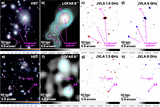
Large-scale image of the z = 1.709 cluster of galaxies SpARCS1049+56. Top left (a): composite HST image (F105W in blue and green; F160W in red) of the cluster. We highlight the location of the BCG and a foreground z ∼ 0.35 galaxy located to the southeast, labeled S3 in Figure 3 and discussed in Appendix B. Top right (b): XMM-Newton 0.5–2.0 keV X-ray image of the cluster. The image has been smoothed with a Gaussian filter of σ = 2 pixels. Overplotted are the Chandra X-ray contours at 2σrms, 3σrms, 4σrms, and 5σrms in green, which show the compact core of the cluster. The cyan contours show the diffuse extended LOFAR emission and are the same as the bottom-left plot. Bottom left (c): 144 MHz LOFAR 9″ image (Dutch stations only) with a beam size of 8﹩\mathop{.}\limits^{\unicode{x02033}}﹩9 × 4﹩\mathop{.}\limits^{\unicode{x02033}}﹩9. Contours are 2σrms, 3σrms, 4σrms, 5σrms, and 6σrms, where σrms = 35 μJy beam−1. This image reveals a diffuse extended halo. Bottom right (d): 144 MHz LOFAR image, obtained with the International LOFAR Telescope, with a beam size of 0﹩\mathop{.}\limits^{\unicode{x02033}}﹩39 ×0﹩\mathop{.}\limits^{\unicode{x02033}}﹩22. The contours are the same as the bottom-left plot. Here, the only source detected is the AGN in the foreground z ∼ 0.35 galaxy, implying that the emission detected in the bottom left is of a diffuse nature. Color bars are included for radio images in units are Jy beam−1.
Other Images in This Article
Copyright and Terms & Conditions
© 2025. The Author(s). Published by the American Astronomical Society.