Image Details
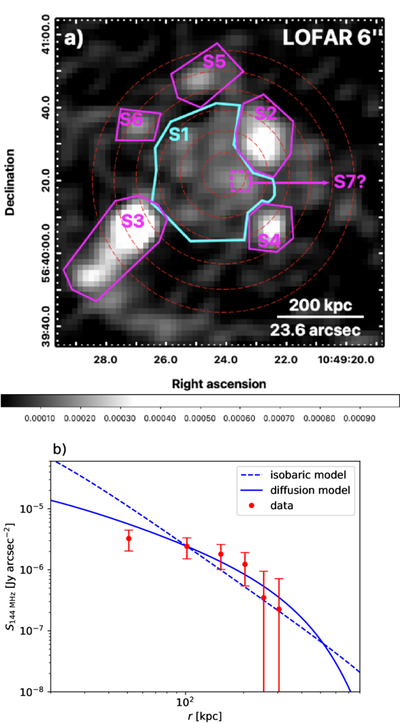
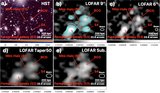
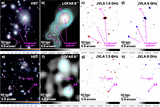
Caption: Figure 3.
Top (a): 144 MHz LOFAR 6″ image of SPARCS1049+56, highlighting key components: S1 is the candidate radio minihalo (Section 3.1). All other regions, shown in magenta, are excluded when computing the radio power of the minihalo and when extracting the radio profile shown in the bottom panel. S2 is the star-forming region (Section 3.2); S3 and S4 are foreground galaxies, masked and discussed in Appendix B; S5 and S6 are also masked; and S7? is a possible contaminating AGN and also discussed in Appendix B. Red dashed circles mark the radial bins used to extract the azimuthally averaged radio profile (bottom panel). Color bar units are Jy beam−1. Bottom (b): comparison of the azimuthally averaged radio profile at 144 MHz (red) and the radio emission predicted by the hadronic model (blue) for the radio minihalo in SpARCS1049+56, assuming a diffusing CR distribution from the central AGN. We adopt a magnetic profile ﹩B(r)={B}_{0}{({n}_{{\rm{e}}}/{n}_{0})}^{1/3}﹩ with B0 = 15 μG.
Other Images in This Article
Copyright and Terms & Conditions
© 2025. The Author(s). Published by the American Astronomical Society.