Image Details
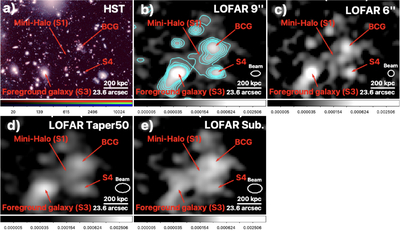
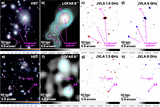
Caption: Figure A1.
(a) Composite HST image (F105W in blue and green; F160W in red) of the SpARCS1049+56, with contours from panel (b). (b) 144 MHz LOFAR 9″ image with a beam of 8﹩\mathop{.}\limits^{\unicode{x02033}}﹩9 × 5﹩\mathop{.}\limits^{\unicode{x02033}}﹩9. Contours are 2σrms, 3σrms, 4σrms, 5σrms, and 6σrms where σrms = 35 μJy beam−1 (also shown in panel (a)). (c) 144 MHz LOFAR 6″ image with a beam of 6﹩\mathop{.}\limits^{\unicode{x02033}}﹩0 × 6﹩\mathop{.}\limits^{\unicode{x02033}}﹩0 and σrms = 33 μJy beam−1. (d) 144 MHz LOFAR image but with a uv taper of 50 kpc. The resulting beam size is 13﹩\mathop{.}\limits^{\unicode{x02033}}﹩8 × 8﹩\mathop{.}\limits^{\unicode{x02033}}﹩6 and σrms = 53 μJy beam−1. (e) Attempted point source subtraction as detailed in E. Osinga et al. (2021). This attempt is only partially successful since the emission still shows peaks in the location of the compact sources seen in the 6″ image. Here, the resulting beam is 13﹩\mathop{.}\limits^{\unicode{x02033}}﹩8 × 8﹩\mathop{.}\limits^{\unicode{x02033}}﹩6 and σrms = 43 μJy beam−1. This figure shows the presence of a diffuse extended emission in all radio images. We provide a zoom-in of the foreground galaxies labeled as S3 and S4 in Figure B1. Color bars are included; radio image units are Jy beam−1.
Other Images in This Article
Copyright and Terms & Conditions
© 2025. The Author(s). Published by the American Astronomical Society.