Image Details
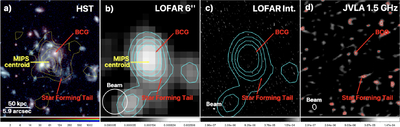
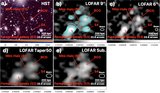
Caption: Figure 2.
Zoom-in on the star-forming region of SpARCS1049+56, labeled as S2 in Figure 3. Left (a): composite HST image (F105W in blue and green; F160W in red), highlighting the BCG and the star-forming tidal-like tail. Overlaid yellow contours represent the Spitzer 24 μm emission from T. Webb et al. (2015a) at 2σrms, 3σrms, 4σrms, and 5σrms. The centroid of the MIPS emission is highlighted, and the emission appears slightly extended along the star-forming tail. Middle left (b): 144 MHz LOFAR 6″ image with a beam of 6﹩\mathop{.}\limits^{\unicode{x02033}}﹩0 × 6﹩\mathop{.}\limits^{\unicode{x02033}}﹩0. Contours are 4σrms, 6σrms, 8σrms, and 10σrms, where σrms = 33 μJy beam−1. The centroid of the MIPS emission coincides with the peak of the radio emission (labeled S2 in Figure 3). Middle right (c): 144 MHz LOFAR image obtained with the International LOFAR Telescope, with a beam of 0﹩\mathop{.}\limits^{\unicode{x02033}}﹩39 × 0﹩\mathop{.}\limits^{\unicode{x02033}}﹩22, using the same low-resolution contours as in the middle-left panel. No source is detected, indicating that the LOFAR emission in the middle-left panel is of diffuse origin. Right (d): JVLA 1.5 GHz image from A. Trudeau et al. (2019), with contours at 3σrms, 4σrms, and 5σrms, where σrms = 10.5 μJy beam−1. Color bars are included; radio image units are Jy beam−1.
Other Images in This Article
Copyright and Terms & Conditions
© 2025. The Author(s). Published by the American Astronomical Society.