Image Details
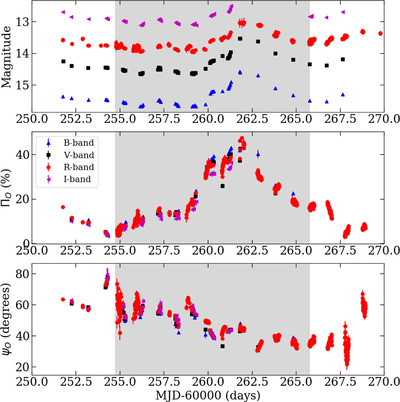
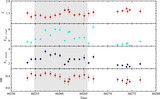
Caption: Figure 7.
Optical polarization measurements during the IXPE observation. The top panel shows the brightness in magnitudes, the middle panel the polarization degree (%), and the bottom panel the polarization angle (degrees). The gray shaded area marks the duration of the IXPE observation. The different optical bands are marked with different symbols and colors as shown in the legend. The error bars correspond to the 68% (1σ) confidence interval.
Other Images in This Article
Copyright and Terms & Conditions
© 2025. The Author(s). Published by the American Astronomical Society.
Copyright ©
2026 Astronomy Image Explorer. All Rights Reserved.