Image Details
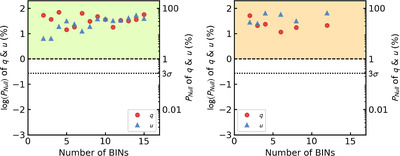
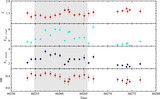
Caption: Figure 6.
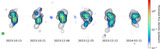
Null hypothesis probability of a constant model of the q (red) and u (blue) Stokes parameters for different time (left panel) and energy (right panel) bins. The green and orange shaded areas indicate that the null hypothesis probability is above the 1% threshold level. The black dashed and dotted lines located in the middle of each panel represent 1% and 3σ (0.27%) probability, respectively. The left and right vertical axes of each panel correspond to the probability values in logarithmic and linear scales in percentage, respectively.
Other Images in This Article
Copyright and Terms & Conditions
© 2025. The Author(s). Published by the American Astronomical Society.
Copyright ©
2026 Astronomy Image Explorer. All Rights Reserved.