Image Details
Caption: Figure 3.
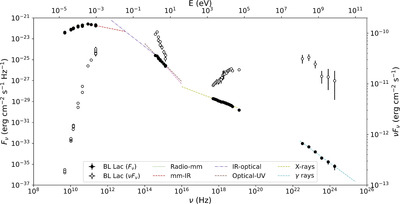
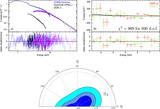
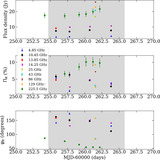
Flux density F ν (black markers; in units of erg cm−2 s−1 Hz−1) at frequency ν (Hz) and SED (open markers; in units of erg cm−2 s−1) of BL Lac from radio to γ-ray frequencies during the time span of the IXPE observations. The different colored lines correspond to the power-law fits used for the estimation of the spectral indices (α, where F ν ∝ ν α ) of each band, as specified in the legend and the Appendix, Table 4.
Other Images in This Article
Copyright and Terms & Conditions
© 2025. The Author(s). Published by the American Astronomical Society.
Copyright ©
2026 Astronomy Image Explorer. All Rights Reserved.