Image Details
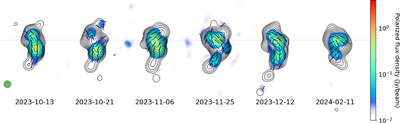
Caption: Figure 9.
Sequence of 43 GHz VLBA images of BL Lac from the BEAM-ME program at 0.1 mas angular resolution. Contours represent total flux density from 0.01 Jy beam−1 (the lowest contour on every image) to 5.50 Jy beam−1 (the highest contour). There are 10 logarithmically equally spaced total flux contours from those minimum and maximum levels. The short sticks symbolize the direction of the electric vector polarization angle.
Other Images in This Article
Copyright and Terms & Conditions
© 2025. The Author(s). Published by the American Astronomical Society.
Copyright ©
2026 Astronomy Image Explorer. All Rights Reserved.