Image Details
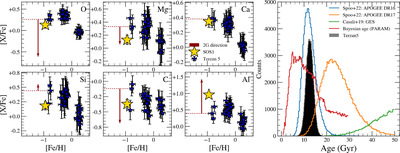
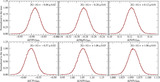
Caption: Figure 4.
Chronochemical comparison between SOS1 and Terzan 5. The abundances of α elements, C, and Al vs. the iron content [Fe/H] for Terzan 5 (L. Origlia et al. 2011, 2013; blue) and SOS1 (yellow). The arrow in each panel shows the average maximum difference (A. P. Milone et al. 2018) between 1G (dotted line) and 2G for a metallicity around [Fe/H] = −1.0, the Terzan 5's popC (the arrows are shifted in the x-axis to make the plot clearer). The rightmost panel shows the age distribution for Terzan 5 (black histogram) compared to different age determinations for SOS1 (colored lines).
Other Images in This Article
Copyright and Terms & Conditions
© 2024. The Author(s). Published by the American Astronomical Society.
Copyright ©
2025 Astronomy Image Explorer. All Rights Reserved.