Image Details
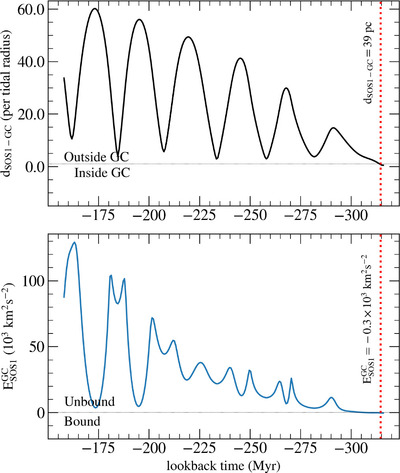
Caption: Figure 2.
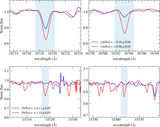
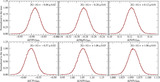
Dissociation point selection criteria (Interactive figure). The top panel shows the SOS1 distance to GC’s center in units of tidal radius as a function of time. The black horizontal dotted line shows the tidal radius region limiting the cluster volume. The bottom panel shows the SOS1 total energy with respect to the GC as a function of time. The black horizontal dotted line represents the bound energy limit. The red dotted lines show the dissociation point with the corresponding distance to the cluster center (top panel) and the bound energy (bottom panel).
An interactive version of this figure is available in the online article.
An interactive version of this figure is available.
An interactive version of this figure is available in the online journal.
Other Images in This Article
Copyright and Terms & Conditions
© 2024. The Author(s). Published by the American Astronomical Society.