Image Details
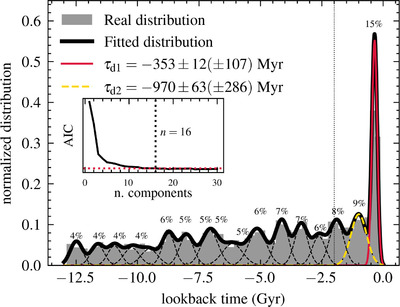
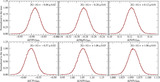
Caption: Figure 3.
Dissociation time calculation. The gray histogram shows the distribution of lookback time obtained from the dissociation points. The black solid line shows the multiple Gaussian distribution obtained through the GMM fitting, and the individual Gaussians are as black thin dashed lines. The two significant dissociation times τd1 and τd2 are highlighted as red and yellow lines, respectively. The number above each Gaussian represents the individual contribution to the total fitting. The inset plot shows the AIC test.
Other Images in This Article
Copyright and Terms & Conditions
© 2024. The Author(s). Published by the American Astronomical Society.
Copyright ©
2025 Astronomy Image Explorer. All Rights Reserved.