Image Details
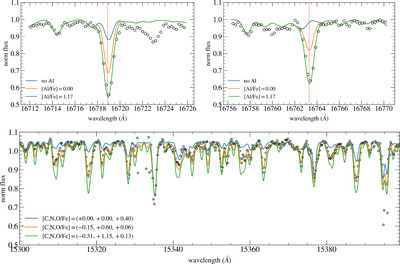
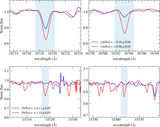
Caption: Figure 6.
Verification of APOGEE-ASPCAP abundances. Upper panels: spectrum synthesis of Al. The colored lines represent synthetic spectra with no Al abundance (blue), solar Al abundance (orange), and [Al/Fe] = 1.17 (green—the value provided by APOGEE). Bottom panels: spectrum synthesis of C, N, and O. The blue line is the normal CNO abundance set [C, N, O/Fe] = (0.0, 0.0, +0.40) and the orange line [C, N, O/Fe] = (–0.15, +0.60, +0.06) and green line [C, N, O/Fe] = (–0.31, +1.15, +0.13) the set provided by APOGEE.
Other Images in This Article
Copyright and Terms & Conditions
© 2024. The Author(s). Published by the American Astronomical Society.
Copyright ©
2025 Astronomy Image Explorer. All Rights Reserved.