Image Details
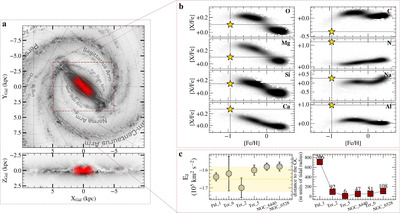
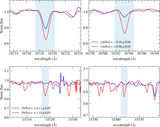
Caption: Figure 1.
Chemodynamical properties of SOS1. (a) X–Y and X–Z density projections of the Galaxy with the orbit of SOS1 star (red line). (b) Abundances of and light elements for SOS1 (yellow star symbol) compared with field stars in the inner Galaxy (density plot). (c) The left panel shows the Jacobi energy of the GCs compatible within 1σ with SOS1 (shaded yellow region), and the right panel shows the SOS1 distance to the center of the selected clusters.
Other Images in This Article
Copyright and Terms & Conditions
© 2024. The Author(s). Published by the American Astronomical Society.
Copyright ©
2025 Astronomy Image Explorer. All Rights Reserved.