Image Details
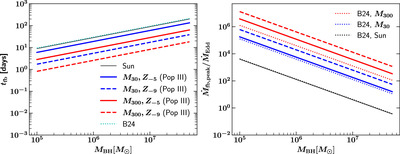
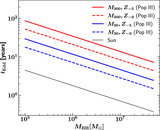
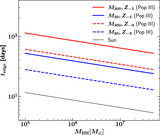
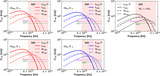
Caption: Figure A2.
The fallback time t fb and peak debris mass fallback rate ﹩{\dot{M}}_{\mathrm{fb},\mathrm{peak}}﹩ as functions of the MBH mass using both the GR13 model and the B24 model. The solid and dashed lines are the same as Figure 3 (based on the GR13 model). The cyan dotted line in the left panel represents the fallback time using the B24 model. The black, blue, and red dotted lines in the right panel correspond to ﹩{\dot{M}}_{\mathrm{fb},\mathrm{peak}}﹩ in the TDEs of a solar-type Pop I star, a 30M ⊙ Pop III star, and a 300M ⊙ Pop III star, respectively, using the B24 model.
Other Images in This Article
Show More
Copyright and Terms & Conditions
© 2024. The Author(s). Published by the American Astronomical Society.