

Image Details
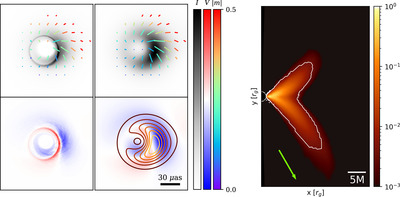
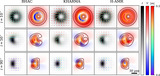
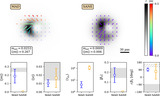
Caption: Figure 9.
The best-bet model of Sgr A*: MAD a * = 0.94, R high = 160, i = 150° aligned. In the left two columns, we plot its simulated image in the style of Figure 5. Images in the first column are unblurred, and images in the second column are blurred with a Gaussian with an FWHM of 20 μas, approximating EHT resolution. In the right panel, we provide a map of the emission in this model. The white contour encloses 90% of the total emission, the dashed white circle demarcates the horizon, and the green arrow indicates our viewing angle. While the emission peaks close to the BH in the midplane, a significant fraction of emission originates from a more diffuse region, including the jet sheath.
Other Images in This Article

Show More
Copyright and Terms & Conditions
© 2024. The Author(s). Published by the American Astronomical Society.

