

Image Details
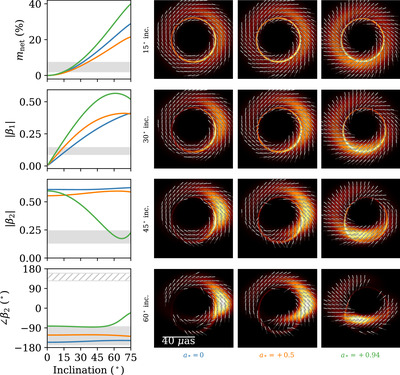
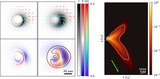
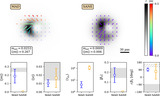
Caption: Figure 4.
Left column: image quantities determined from simplified analytic KerrBAM models evaluated using MAD GRMHD fluid velocities and magnetic fields of three spins. In this and subsequent figures, we plot our observational constraints as gray bands for reference, with the ∠β 2 constraint prior to RM derotation shown as a hatched region. We use this model to understand key trends, but we caution that more physically complete GRMHD models are necessary for quantitative comparison. Right three columns: corresponding KerrBAM images evaluated at four example inclinations.
Other Images in This Article

Show More
Copyright and Terms & Conditions
© 2024. The Author(s). Published by the American Astronomical Society.

Copyright ©
2026 Astronomy Image Explorer. All Rights Reserved.
