

Image Details
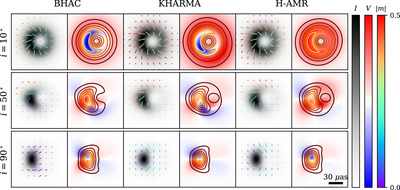
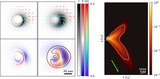
Caption: Figure 5.
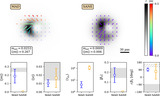
Gallery of example time-averaged simulations in our library. Each panel displays a time-averaged and blurred (with a 20 μas FWHM Gaussian kernel) MAD a * = 0.94, R high = 40 aligned models at three different inclinations. The first panel of each set displays total intensity and linear polarization, while the second panel of each set displays total intensity and circular polarization. Tick lengths scale the total polarized flux density in a given pixel, while their colors scale with the polarization fraction. H-AMR models are ray-traced only for a subset of models for comparison and are not used for scoring.
Other Images in This Article

Show More
Copyright and Terms & Conditions
© 2024. The Author(s). Published by the American Astronomical Society.

