

Image Details
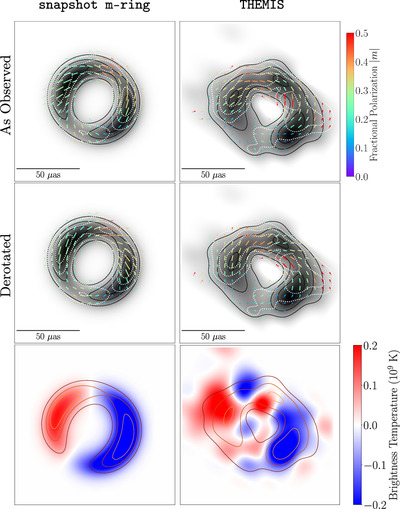
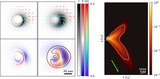
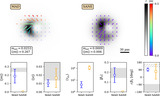
Caption: Figure 1.
Polarized images of Sgr A* used for physical interpretation in this work. Two methods from Paper VII, snapshot m-ring and THEMIS, are included. Top and middle: total intensity is shown in gray scale, polarization ticks indicate the EVPA, the tick length is proportional to the linear polarization intensity magnitude, and color indicates fractional linear polarization. The dotted contour levels correspond to linearly polarized intensities of 25%, 50%, and 75% of the polarization peak. The solid contour levels indicate total intensity at 25%, 50%, and 75% of the peak brightness. The top row shows images without derotation, and the middle row shows images with a derotation of 46.0 deg to account for Faraday rotation. Bottom: total intensity is indicated in solid colored contours at 25%, 50%, and 75% of the peak brightness, and the Stokes ﹩{ \mathcal V }﹩ brightness is indicated in the diverging color map, with red/blue indicating a positive/negative sign.
Other Images in This Article

Show More
Copyright and Terms & Conditions
© 2024. The Author(s). Published by the American Astronomical Society.

