

Image Details
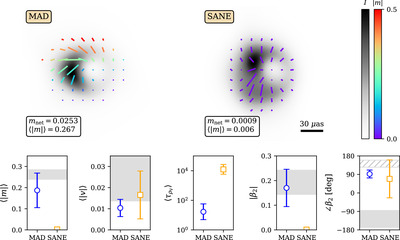
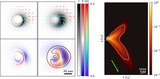
Caption: Figure 10.
Comparison of the MAD and SANE a * = 0.5, R high = 40, i = 50° aligned models (KHARMA images plotted). As in Figure 5, the lengths of the ticks scale with the polarized flux in each pixel, normalized for each model individually. A selection of polarimetric observables are shown with theoretical error bars, along with our observational constraints in gray. The constraint on ∠β 2 prior to RM derotation is shown with a hatched band instead of a filled band. With other parameters held fixed, SANE models typically have lower resolved linear polarization owing to higher Faraday depths and can sometimes reach large values of circular polarization. Large Faraday depths in SANEs result in lower values of 〈∣m∣〉 and ∣β 2∣.
Other Images in This Article

Show More
Copyright and Terms & Conditions
© 2024. The Author(s). Published by the American Astronomical Society.

