

Image Details
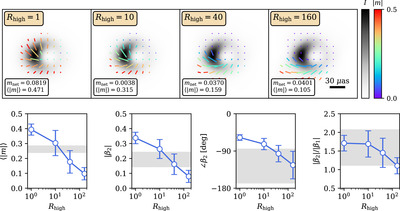
Caption: Figure 13.
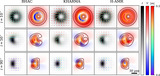
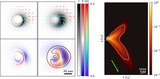
Time-averaged images and a selection of polarimetric observables as a function of R high, for the slice of our parameter space corresponding to MAD a * = 0.5, i = 130° aligned models (BHAC images plotted). In this slice of parameter space, Faraday rotation has a clear effect, since increasing R high leads to smaller linear polarization fractions and correspondingly ∣β 2∣. At this inclination, sight lines at the top of the image pass through the Faraday thick-disk midplane, increasing the polarization asymmetry as R high increases, which is reflected in ∣β 2∣/∣β 1∣. Both line-of-sight Faraday rotation and changing emission regions lead to a trend in ∠β 2.
Other Images in This Article

Show More
Copyright and Terms & Conditions
© 2024. The Author(s). Published by the American Astronomical Society.

