Image Details
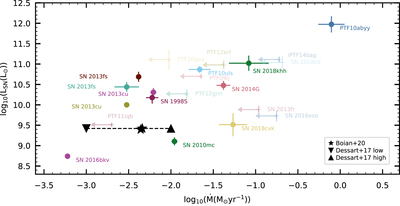
Caption: Figure 6.
The SN luminosity and mass-loss rate derived by Boian & Groh (2020) for a sample of 17 SNe compared to the best model of SN 2023ixf (black). Upper limits on mass loss are shown with semitransparent markers and arrows, while determined values are solid. We determine a scaled mass-loss rate of ﹩\dot{M}\approx 4.5\times {10}^{-3}﹩ M ⊙ yr−1 and a scaled luminosity of L ≈ 2.6 × 10⁹ L ⊙ from the models of Boian & Groh (2019; with slight variation due to different surface abundances), which we plot as black stars. In practice, these are located at virtually the same location on this plot. We also include the mass-loss rates of the r1w4 and r1w6 models of Dessart et al. (2017) (﹩\dot{M}={10}^{-3}﹩ M ⊙ yr−1, and ﹩\dot{M}={10}^{-2}﹩ M ⊙ yr−1, respectively), which are shown as black triangles. Dessart et al. (2017) does not explore variations in luminosity, and we therefore use the luminosity derived from Boian & Groh (2019) solar abundance models and do not scale the mass-loss rates. The mass-loss rate of SN 2023ixf is in line with the lower end of the range of mass-loss rates in this sample.
Other Images in This Article
Copyright and Terms & Conditions
© 2023. The Author(s). Published by the American Astronomical Society.