Image Details
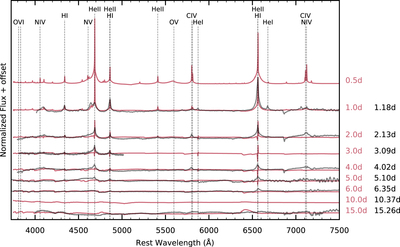
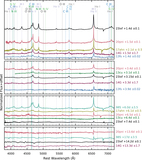
Caption: Figure 5.
A comparison of the spectral evolution of SN 2023ixf (black) to the r1w4 model of Dessart et al. (2017; pink). Phases are shown to the right of the figure in pink for the model and black from the observed spectra. While the first observation at 1.2 days matches fairly well, the model spectra evolve much more rapidly, with P Cygni profiles developing at day 2 and all emission disappearing by day 4, while the observations show emission through days 6–7. The model spectrum at 0.5 day shows a number of lines that have faded by 1 day (e.g., N V).
Other Images in This Article
Copyright and Terms & Conditions
© 2023. The Author(s). Published by the American Astronomical Society.
Copyright ©
2026 Astronomy Image Explorer. All Rights Reserved.