Image Details
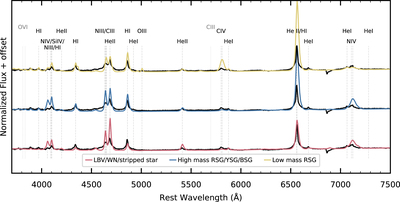
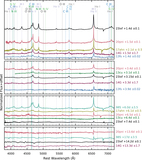
Caption: Figure 4.
The day 1.36 spectrum (black) compared with three different surface abundance models from Boian & Groh (2019) with L = 1.5 × 10⁹ L ⊙, and ﹩\dot{M}=3\times {10}^{-3}﹩ M ⊙ yr−1. The solar abundance represents a low-mass RSG (yellow), CNO-processed abundance represents a high-mass star (RSG, BSG, or YSG; blue), and He-rich abundance represents an LBV, WN, or other stripped star (pink). Vertical dashed lines represent the ions that are identified in the observed spectra that are labeled at the top of the plot. Vertical dotted lines in light gray show ions that are not detected but are part of the progenitor diagnostics detailed in Boian & Groh (2019). We convolve the model spectra with a Gaussian kernel to mimic the resolution of the observed spectra. While some individual features in each model are matched by the observed spectrum, there are differences between the model and observed spectrum that indicate that the conditions of the model are not the same as the observations.
Other Images in This Article
Copyright and Terms & Conditions
© 2023. The Author(s). Published by the American Astronomical Society.