Image Details
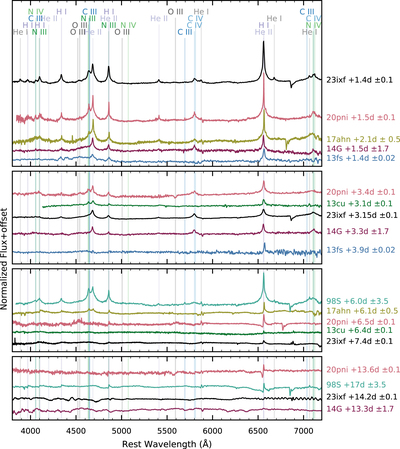
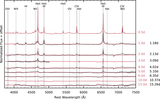
Caption: Figure 3.
A comparison of SN 2023ixf (black) to SN 1998S (teal; Leonard et al. 2000), SN 2013fs (blue; Yaron et al. 2017), SN 2013cu (green; Gal-Yam et al. 2014), SN 2014G (purple; Terreran et al. 2016), SN 2017ahn (mustard; Tartaglia et al. 2021), and SN 2020pni (pink; Terreran et al. 2022) ∼1, 3, 7, and 14 days after explosion. These SNe all have flash features that evolve over the first two weeks. The SN name and epoch are marked to the right of the plot. All spectra have been redshift and extinction corrected and then normalized by a blackbody fit to the continuum. Emission lines identified in the first spectrum are marked with vertical lines, which are labeled at the top of the figure. In the first epoch, SN 2023ixf closely resembles SNe 2020pni and 2017ahn, although at later epochs it more closely follows SN 2014G. SN 2013fs is considerably different in its evolution throughout the first two weeks. At later epochs, SN 2020pni and SN 1998S develop narrow P Cygni profiles that are not present in the spectra of other SNe.
Other Images in This Article
Copyright and Terms & Conditions
© 2023. The Author(s). Published by the American Astronomical Society.