Image Details
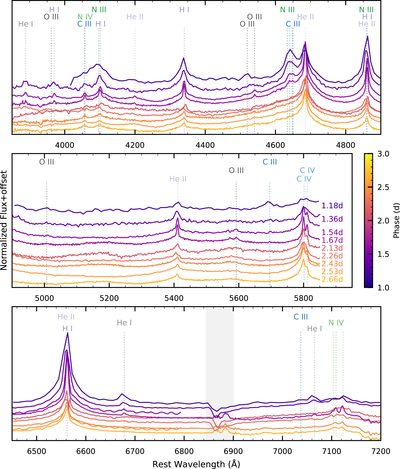
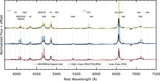
Caption: Figure 2.
The evolution of SN 2023ixf from day 1.18 through day 3, colored by phase. Ions are labeled in each panel, and the phase is given in the middle panel. Emission lines from the low-ionization levels, He I, N III, C III, O III, and N IV (λ 5074 Å), disappear over the first 0.5 day of evolution while emission from high-ionization levels, N IV (λ λ7103, 7109, λ7122), He II (λ4685.5), and C IV (λ λ 5801.3, 5811.98 Å), increase in strength. Spectra are fit with a blackbody function and normalized, corrected for redshift, and offset for readability. In the bottom panel, the B-band telluric feature is marked with a gray shaded region.
Other Images in This Article
Copyright and Terms & Conditions
© 2023. The Author(s). Published by the American Astronomical Society.