Image Details
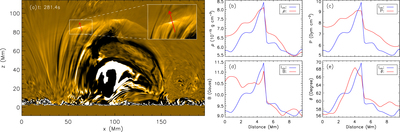
Caption: Figure 5.
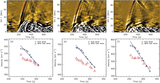
Changes of physical quantities across the wave front. (a) Running difference of synthetic 171 Å image for a 2D vertical slice cutting through the apex of the wave front. The red arrow indicates the normal direction of the wave front, a slit along which the physical quantities are displayed in (b)–(e). Variations of the plasma density (b), pressure (c), magnetic field strength (d), and the angle between the magnetic field and the normal direction of the wave front (e) along the arrow, with the smaller distance on the downstream and larger distance on the upstream. The wave front is at about 5.5 Mm. The blue lines in (b)–(e) are identical and plot the AIA 171 Å intensity. It is important to note that all the curves show the original physical quantities but not their running differences.
Other Images in This Article
Copyright and Terms & Conditions
© 2021. The American Astronomical Society. All rights reserved.