Image Details
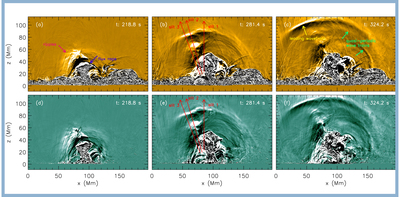
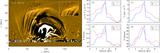
Caption: Figure 2.
Running difference of the synthetic AIA 171 Å (top row) and 94 Å (bottom row) images showing the propagation of an EUV wave associated with a flux rope eruption in the simulation. The pink, blue, yellow, and green arrows indicate features that are described in Section 3.1. The three red arrows in (b) and (e) refer to the slits used to trace the propagation of the wave front. The animated version covers a time period from 12.1 to 743.7 s in the simulation.
(An animation of this figure is available.)
The video/animation of this figure is available in the online journal.
Other Images in This Article
Copyright and Terms & Conditions
© 2021. The American Astronomical Society. All rights reserved.
Copyright ©
2026 Astronomy Image Explorer. All Rights Reserved.