Image Details
Caption: Figure 1.
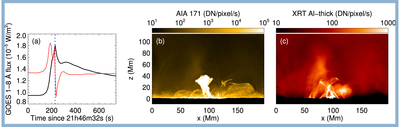
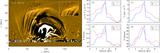
Overview of the flare event simulated by the MURaM code that triggers the coronal EUV wave. (a) Synthetic GOES-15 1–8 Å flux. The red line shows the temporal derivative of the GOES flux, which is considered as the indicator of the impulsive phase. The blue dotted line indicates the time instance of the image shown in (b) and (c). (b) Synthetic AIA 171 Å image at the flare peak (t = 228 s). The view point corresponds to observing an event that occurs at the solar limb. (c) Synthetic XRT Al-thick image at the same time and from the same view point as in (b). The animated version shows an evolution of 743.7 s.
(An animation of this figure is available.)
The video/animation of this figure is available in the online journal.
Other Images in This Article
Copyright and Terms & Conditions
© 2021. The American Astronomical Society. All rights reserved.