Image Details
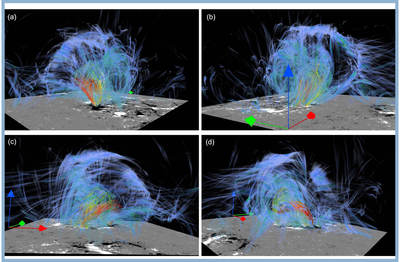
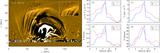
Caption: Figure 3.
The wave front in the 3D space. This snapshot is at t = 281 s, which is the same as that for Figure 2. The red, green, and blue arrows identify the origin of the Cartesian coordinate system in the simulation. The data have been shifted in the y-direction (periodic), such that the eruption is placed in the center region of the domain. The blue-colored structure shows the wave front by the running difference of ﹩{n}_{e}^{2}﹩. The magnetic field lines represent the rising magnetic flux rope, and their color indicates the temperature of plasma there, with white for cool plasma (105 K) and red for hot plasma (107 K). The 3D visualization is produced by VAPOR (Clyne et al. 2007). The animated version shows the wave front from multiple perspectives.
(An animation of this figure is available.)
The video/animation of this figure is available in the online journal.
Other Images in This Article
Copyright and Terms & Conditions
© 2021. The American Astronomical Society. All rights reserved.