Image Details
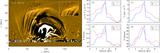
Caption: Figure 4.
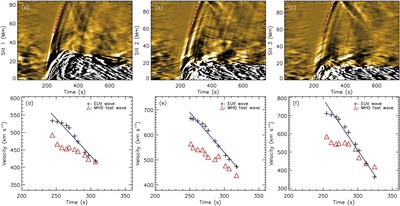
Time–distance diagrams and the propagation speeds of the wave front measured along the three slits. The left, middle, and right columns are for slits 1, 2, and 3, respectively. The horizontal axis represents the real physical time. The positions of the wave front are marked with red crosses in the top row. The black crosses in the bottom row show the propagation speed of the wave front as a function of time, while the red triangles show the local fast magnetoacoustic wave speed. The blue lines show linear fittings of the speed of the wave front.
Other Images in This Article
Copyright and Terms & Conditions
© 2021. The American Astronomical Society. All rights reserved.
Copyright ©
2026 Astronomy Image Explorer. All Rights Reserved.