Image Details
Caption: Figure 2.
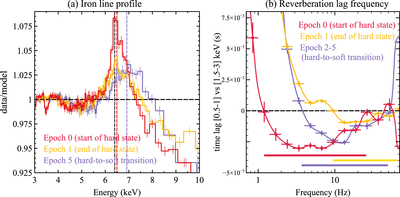
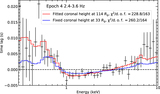
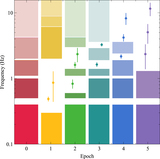
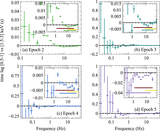
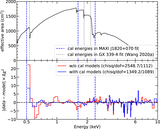
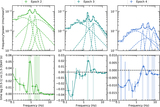
Evolution of iron line profile and reverberation lag frequency. (a) The data-to-model ratios when NICER spectra are fitted in 3–10 keV range with a model of (diskbb+powerlaw). The vertical lines are at 6.4 keV (black), and the fitted Gaussian line energies of 6.48 keV (Epoch 0), 6.52 keV (Epoch 1), and 6.92 keV (Epoch 5). The color of each epoch matches that in Figure 1. (b) The lag-frequency spectra. The logarithmic frequency rebinning factor is 0.4, and we use the convention that a positive lag indicates a hard lag, i.e., the hard photons lag behind the soft ones. The horizontal lines represent the frequency ranges of soft lags. The soft lag frequency increases in the hard state and then decreases during the transition. We show the combined lag-frequency spectrum in the transition (Epochs 2–5) for clarity; the individual epochs exhibit the same decrease of soft lag frequency compared to the end of hard state (see Figure A1 in the Appendix A).
Other Images in This Article

Copyright and Terms & Conditions
© 2021. The American Astronomical Society. All rights reserved.