Image Details
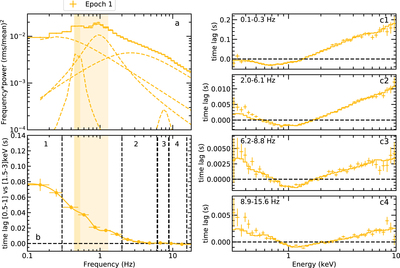
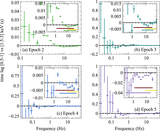
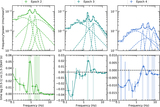
Caption: Figure 4.
Time-lag fit result in Epoch 1. (a) The power spectral density, (b) the lag-frequency spectrum where the dashed lines represent the frequency ranges to extract and fit the lag-energy spectra (c1–c4); the shaded regions are the QPO frequencies (central frequency±HWHM) that we do not include in the time-lag fits. The points in (b) are connected with a Bezier join to guide the eye.
Other Images in This Article

Copyright and Terms & Conditions
© 2021. The American Astronomical Society. All rights reserved.
Copyright ©
2025 Astronomy Image Explorer. All Rights Reserved.