Image Details
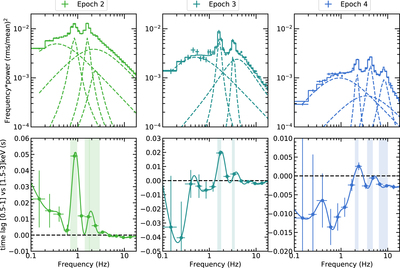
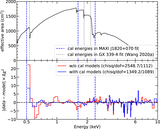
Caption: Figure C1.
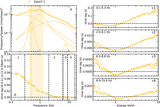
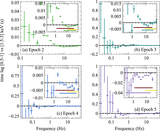
Top row: the power spectral densities and the fitted Lorentzian components. Bottom row: the lag-frequency spectra, where the shaded regions represent the QPO frequencies (central frequency ﹩\pm \mathrm{HWHM}﹩). We find “harder” lags at the frequencies of type-C QPOs and their (sub)harmonics than at neighboring frequencies.
Other Images in This Article

Copyright and Terms & Conditions
© 2021. The American Astronomical Society. All rights reserved.
Copyright ©
2025 Astronomy Image Explorer. All Rights Reserved.