Image Details
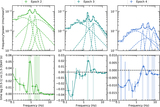
Caption: Figure A1.
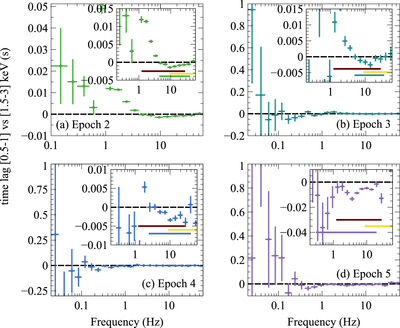
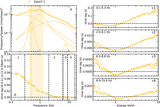
The decrease of reverberation lag frequency can also be seen in individual epochs. The horizontal lines in the inserted plot represent the frequency ranges of soft lags, and the red and yellow frequency ranges are for Epochs 0 and 1 at the start and end of hard state, which serve as benchmarks.
Other Images in This Article

Copyright and Terms & Conditions
© 2021. The American Astronomical Society. All rights reserved.
Copyright ©
2025 Astronomy Image Explorer. All Rights Reserved.