Image Details
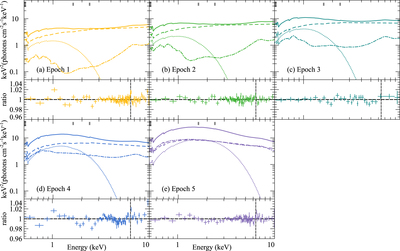
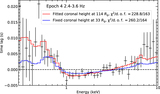
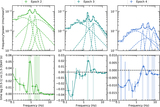
Caption: Figure 3.
The model (top row) and data-to-model ratios (bottom row) when NICER spectra are fitted in 0.5–10 keV range with a model of (tbabs∗diskbb+reltransDCp)∗edge∗edge∗gabs. The total model, the diskbb, the illuminating continuum, and the reflection component are represented by solid, dotted, dashed, and dashed–dotted lines, respectively. The continuum and reflection overlap in Epoch 5 due to a boost parameter of 3.0 ± 1.5, where the best-fit value is larger than previous epochs, but becomes consistent within 90% confidence. The vertical line is at 6.4 keV, and the color of each epoch matches that in Figure 1. In Epochs 1 and 2, the residual is very narrow and peaks precisely at 6.4 keV, and can be modeled with an additional xillverDCp component; while in Epochs 4 and 5 (when the source approaches the jet line), the residual is excess above 6.4 keV (i.e., more blueshifted). See Section 3.2 for more details. The vertical gray bars indicate the characteristic energies of phenomenological models.
Other Images in This Article

Copyright and Terms & Conditions
© 2021. The American Astronomical Society. All rights reserved.