Image Details
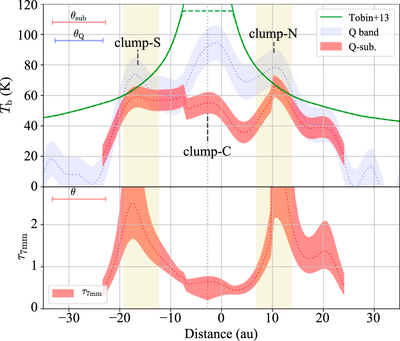
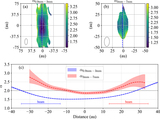
Caption: Figure 3.
(Top) Distribution of the brightness temperature along the midplane. The red and blue dotted lines show those of the subtracted Q band and the original Q band, respectively. The filled color regions represent ±1σ ranges. The temperature model of Tobin et al. (2013) and the modified model are indicated by the solid and dashed green lines, respectively. We also show the sliced beam sizes for the subtracted Q band data (θsub) and the original Q band data (θQ) at the top left. The yellow shaded regions indicate the radial positions for the CO2 snow line (60–80 K). (Bottom) The red shaded region shows ﹩{\tau }_{7\mathrm{mm}}﹩ resulting from Tb of the subtracted data and the model temperatures.
Other Images in This Article

Copyright and Terms & Conditions
© 2020. The American Astronomical Society. All rights reserved.