Image Details
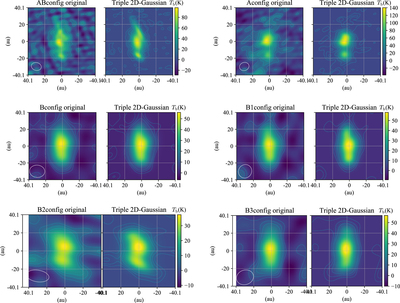
Caption: Figure C1.
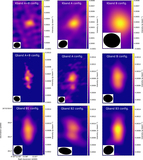
Original Q-band image and triple 2D Gaussian fit for each of array configurations. The cyan contours show 1σ, 2σ, and 3σ levels of the original images and are the same between the right and left panels.
Other Images in This Article

Copyright and Terms & Conditions
© 2020. The American Astronomical Society. All rights reserved.
Copyright ©
2026 Astronomy Image Explorer. All Rights Reserved.