Image Details
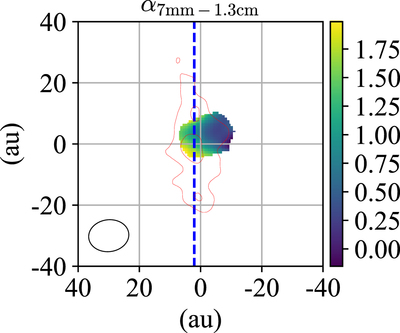
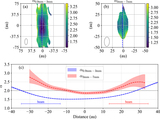
Caption: Figure 2.
Map of the α index derived with the observation data at K and Q bands. The synthesized beam size is shown at the bottom left, and the size is 0.″096 × 0.″076; −82°. The red contours are shown in the same manner as Figure 1.
Other Images in This Article

Copyright and Terms & Conditions
© 2020. The American Astronomical Society. All rights reserved.
Copyright ©
2026 Astronomy Image Explorer. All Rights Reserved.