Image Details
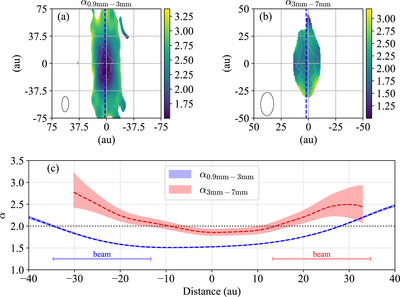
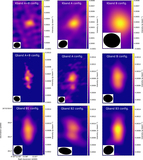
Caption: Figure B1.
(a), (b) Maps for α0.9 mm–3 mm and α3 mm–7 mm, respectively. The synthesized beam is shown by the ellipses at the bottom left in each panel. The beam sizes are 0.″16 × 0.″069; −1.°6 and 0.″16 × 0.″087; −1.°6 for (a) and (b), respectively. The white contours are plotted in the same manner as the blue contours in the JVLA images of Figure 1. The blue dashed lines indicate the midplane. (c) sliced distributions of α along the midplane. The shaded regions represent ±1σ. The dotted black line indicates α = 2 for reference. The sliced beam sizes (∼21 au for both) are shown at the bottom left and bottom right for (a) and (b), respectively.
Other Images in This Article

Copyright and Terms & Conditions
© 2020. The American Astronomical Society. All rights reserved.